The given graph shows the variation of boiling point
of water with pressure.
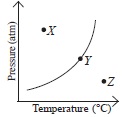
Which of the following best represents the state(s)
of water at points X, Y and Z?
| X | Y | Z | |
| A | Gas, Liquid | Liquid | Solid |
| B | Liquid | Liquid, Gas | Gas |
| C | Solid | Liquid, Solid | Gas |
| D | Liquid | Liquid, Gas | Solid |
ans c