Direction (27-28) : Students created a pictograph that shows the number of apples sold in a food store in one week. Answer the questions based on it.
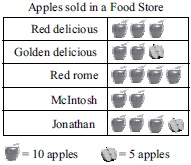
Select the correct bar graph which represents the data shown in pictograph.
A 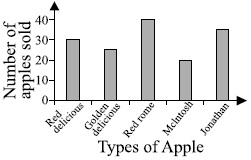
B 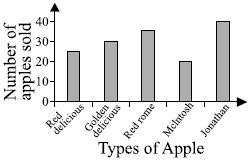
C 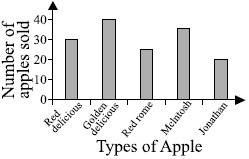
DNone of these