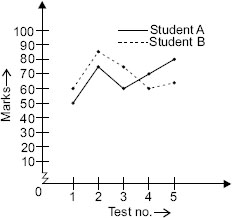
The line graph shows the performance of two students during a year. Read the graph and answer the following questions.
In all, whose performance is better during the year?
A Student A
B Both showed same performance
C Student B
D Can’t be determined
answer is a
Ans 3: (Master Answer)
Class : Class 1
(C): Performance of student A during the year = Total marks of student A
= 50 + 75 + 60 + 70 + 80 = 335
Performance of student B during the year = Total marks of student B
= 60 + 85 + 75 + 60 + 65 = 345
∴ Performance of student B is better during the year.