Refer to the given food web.
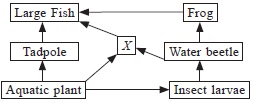
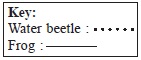
A new species Y was introduced in this community which exclusively feeds on X. Which of the following graph correctly represents population of frog and water beetle after introducing species Y?
A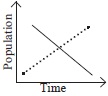
B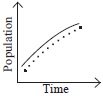
C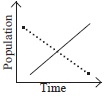
D
Can anyone please clarify this ? Given answer is B
Ans 3:
Class : Class 6
See, Y is feeding on x which means that population of X would definitely decrease. This means that eater of water beetle has decreased. This indicates that population of water beetle will increase. This means more food for fro with beetle. with g. Due to large amount of food frogs' population will also increase parallelly. In this way B would be correct .
Sorry for too long answer.