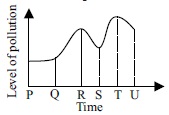
The given graph shows the changes in level of pollution in an area over a time period.
Which of the following can be inferred from the given
graph?
AAt point P a lot of forest land was cleared for
human consumption whereas at point Q large
scale afforestation was done.
BAt point R a new factory was set up in the
area.
CPeople cut down the use of fossil fuels in
the interval S - T as compared to its earlier
usage.
DIntervals R - S and T - U indicate activities like
use of bioinsecticides and biopesticides instead
of chemicals in farming, use of public transport
instead of private transport, etc.
Ans 1: (Master Answer)
D
Use of bio-insecticides and bio-pesticides will bring down the pollution level, and Intervals R – S and T – U show the pollution levels coming down.