The graph shows the different types of food enjoyed by some children during picnic.
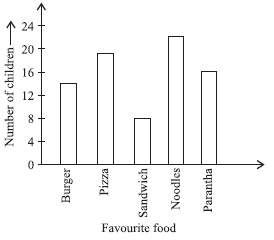
What fraction of the total children like sandwich?
A4/69
B14/69
C22/68
D8/79
will anybody understand this bar graph?
The graph shows the different types of food enjoyed by some children during picnic.
What fraction of the total children like sandwich?
A4/69
B14/69
C22/68
D8/79