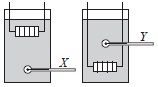
The diagram shows two identical set-ups each consisting of a container filled with water, an electric heater and a thermometer. Only the positions of the electric heater
and the thermometer differ in both set-ups.
Which of the following graphs
represents the approximate
variations of the readings of
the thermometers, X and Y
with time?
A
B
C
D
options are wrong.B and D are same.A and C are also same
Ans 1:
Class : Class 3
aren't Option D and option B almost the same...? Which one should I prefer and why???
Ans 3:
Class : Class 8
No, you should refer to the starting point of the graph.. The temperature at the beginning is also important..
So the right answer is option B
Ans 5:
Class : Class 7
Look at the starting point of the graph. In the beginning the temperature of X and Y is same and they hence start from one common point. So the answer is B.