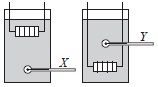
The diagram shows two identical set-ups each consisting of a container filled with water, an electric heater and a thermometer. Only the positions of the electric heater
and the thermometer differ in both set-ups.
Which of the following graphs
represents the approximate
variations of the readings of
the thermometers, X and Y
with time?
A
B
C
D
options are wrong.B and D are same.A and C are also same