The graph given below shows how the temperature of water changes with time.
Hot water was added at certain points during the
experiment.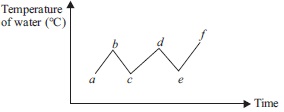
At which points in the graph was hot water added?
Aa and c only
Bb and d only
Ca, c and e only
Db, d and f only
v.useful