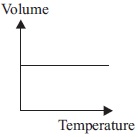
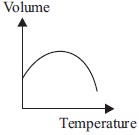
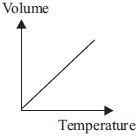
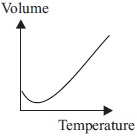
Which of the following graphs correctly shows the change in volume with temperature of water? A B C D