Study the given food chain.

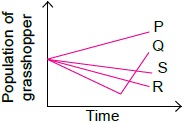
Which of the following graphs illustrates the population of grasshopper following a decrease in the population of frog?
AQ
BR
CS
DP
Ans 3: (Master Answer)
Class : Class 1
D
In the given food chain if the population of frog decreases, then it will lead to an increase in the grasshopper population. As there will be less frogs to feed upon the grasshoppers.