Three similar cages containing same number of pollution sensitive fish X were placed in three different ponds (R, S and T). The given graph shows the change in the number of fish in three cages over time.
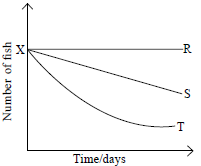
According to the given graph which pond is most
polluted (I) and which pond has the highest concentration
of dissolved oxygen in the water (II)?
A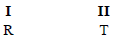
B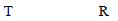
C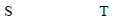
D
B