The line graph shows the number of storybooks Armaan read in the last 4 months of a year.
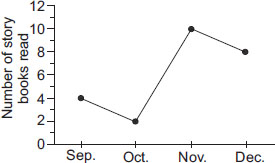
The number of storybooks that he read in October as a fraction of the total number of storybooks read is
A 
B 
C 
D 
The line graph shows the number of storybooks Armaan read in the last 4 months of a year.
The number of storybooks that he read in October as a fraction of the total number of storybooks read is
A
B
C
D