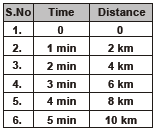
Following table gives the data of distances covered by a car in first five minutes of its journey. The graph which correctly depicts this data is
(A) 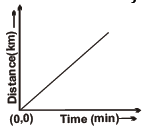
(B) 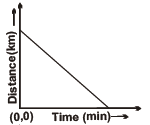
(C) 
(D) 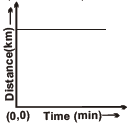
Following table gives the data of distances covered by a car in first five minutes of its journey. The graph which correctly depicts this data is
(A)
(B)
(C)
(D)