Subject :NSO Class : Class 7
The given graph shows changes in the concentration of lactic acid in the muscles of an athlete both during and after race.
At what time did the athletes finish the race?
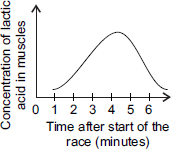
A 2 minutes
B 5 minutes
C 4 minutes
D 6 minutes
Ans 1:
Class : Class 9
yes
Ans 2:
Class : Class 7
c -four minutes
Ans 3:
Class : Class 7
But it's still rising at four, and starts dipping closer to 5 than to 4, so shouldn't 5 be the answer...
Ans 4:
Class : Class 8
The answer is option C
Ans 5:
Class : Class 7
Maybe
Ans 6:
Class : Class 8