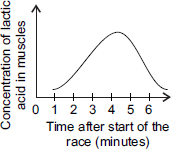
The given graph shows changes in the concentration of lactic acid in the muscles of an athlete both during and after race.
At what time did the athletes finish the race?
A 2 minutes
B 5 minutes
C 4 minutes
D 6 minutes
The given graph shows changes in the concentration of lactic acid in the muscles of an athlete both during and after race.
At what time did the athletes finish the race?
A 2 minutes
B 5 minutes
C 4 minutes
D 6 minutes