The given bar graph shows the number of students (in thousands) who opted for three different specializations during the given five years in a university. Study the graph carefully and answer the questions that follows.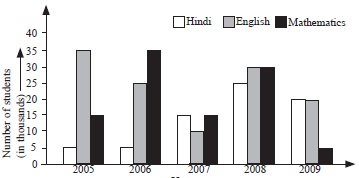
Out of the total number of students who opted for the given three subjects in the year 2009, 38% were girls. How many boys opted for Mathematics in the same year?
A1322
B1332
C27900
DCannot be determined
i think option c is correct