Subject :IMO Class : Class 5
Study the given bar graph which shows
the number of residents residing at 6 different places and
answer the following questions.
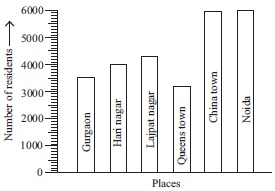
How many residents were residing at Queens town?
A 3000
B 3500
C 3400
D 4000
how? graph shows 3200
Ans 1:
Class : Class 5
please try to modify the given graph as it is very difficult to count the numbers in the the given graph
Ans 2:
Class : Class 5
IT IS 3300
Ans 3:
Class : Class 5
the markings are not clear. cant use a scale on my laptop. would have been okay if you would have made lines
Ans 4:
Class : Class 7
It doesn't look clear. Please draw it properly
Ans 5:
Class : Class 5
Ans 6:
Class : Class 5
Ans 7:
Class : Class 6
its coming to 3000, so A is answer
Ans 8:
Class : Class 6
The answer is a it is straight to 3000
Ans 9:
Class : Class 8
The graph isn't clear . It looks like 3200
Ans 10:
Class : Class 8
Please modify the graph and the number at Queens town is 3300
Ans 11:
Class : Class 10
PLEASE TRY TO MAKE THE MARKINGS MORE CLEARER
Ans 12:
Class : Class 5
it is 3300, not 3400they should make the markings more clear.
Ans 13:
Class : Class 5
It is looking like 3300! Please make it clear and not so close
Ans 14:
Class : Class 5
Ans 15:
Class : Class 5
IT IS 3300
Ans 16:
Class : Class 7
THE GRAPH IS NOT CLEARTHE ANSWER IS COMING LIKE 3300
Ans 17:
Class : Class 5
MAKE IT CLEAR CANNOT UNDERSTAND THE MARKINGS
Ans 18:
Class : Class 5
Ans 19:
Class : Class 7
yes please mark it if it was a paper then i would have used a scale but not possible here
Ans 20:
Class : Class 5
write it properly
Ans 21:
Class : Class 5
IT IS 3300