In a field research, some rats were kept in a wheat field. Which of the following graphs shows the change in the number of wheat plants over a certain period?
A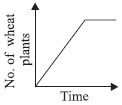
B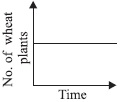
C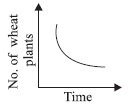
D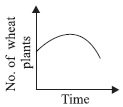
Ans 3:
Class : Class 7
In a field research, some rats were kept in a wheat field. Their presence in the wheat field would affect the number of wheat plants over a certain period of time.Rats burrow in the soil of wheat field and cause damage to the crop roots. So, the number of wheat plants would fall over a period of time. Rats also feed on ripening ear heads and ripened grains. So, their population would increase fast. The more they are in number, the more damage they would cause to the plant roots, and the more grains they would eat.So, the number of wheat plants in the field would keep decreasing.The following graph would show the change in the number of wheat plants correctly:In the above graph, the number of wheat plants is constantly falling over a period of time. Hence, the right answer is Option C.