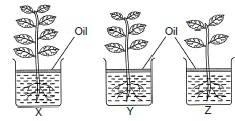
Three plants (X, Y and Z) were put into three identical
containers filled with 500 mL of water as shown in
the figure. Some oil was poured into each container
which formed a thin layer above water to prevent
water loss through evaporation. The containers were
kept outdoor at the same place.
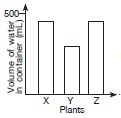
Which of the following graphs correctly depicts the
volume of water in the three containers after two
days?
A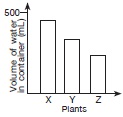
B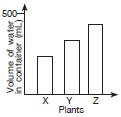
C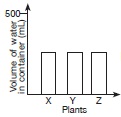
D