In a forest, due to heavy hunting, the population of lions has reached extinction. This will have a major effect on the population of deer. Which of the following graphs will correctly depict this effect ? Y-Number of deer, X-Time
A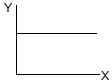
B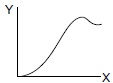
C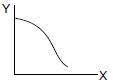
D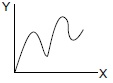
i need the explanation please