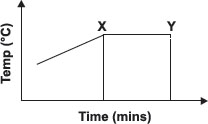
The given graph shows the temperature of water as it is heated. The period from X to Y shows ______.
A Melting point
B Water gain
C Heat loss
D Boiling point
Ans 3: (Master Answer)
Class : Class 1
The correct answer is D.
The given graph shows that the temperature of water is not increasing with time from period ‘X’ to ‘Y’, which shows that drum. water has attained its boiling point (100°C). On reaching boiling point, the temperature of water does not increase further and water converts into vapour.