The given graph shows the temperature taken on a certain day.
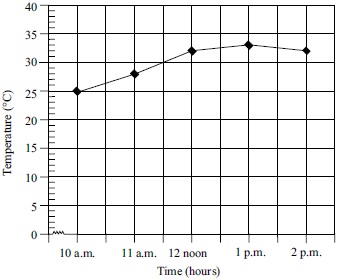
The increase in temperature is greatest from ________.
A10 a.m. to 11 a.m.
B11 a.m. to 12 noon
C12 noon to 1 p.m.
D1 p.m. to 2 p.m.
The given graph shows the temperature taken on a certain day.
The increase in temperature is greatest from ________.
A10 a.m. to 11 a.m.
B11 a.m. to 12 noon
C12 noon to 1 p.m.
D1 p.m. to 2 p.m.