Subject :NSO Class : Class 3
A beaker of water was heated continuously over a burner and the temperature of the water was recorded simultaneously. The graph obtained on plotting this data is shown here. Which one of the following best explains what happened between points E and F on the graph?
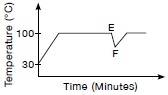
AThe water in the beaker was stirred.
BThere is no more water left in the beaker.
CSome iced water was poured into the beaker.
DSome boiling water was poured into the beaker.
Ans 1:
Class : Class 3
Ans 2:
Class : Class 7
w4aestdryuvghibj