The given bar graph shows the demand and production of colour T.Vs of five companies.
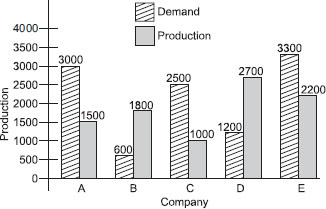
What is the difference between average demand and average production of the five companies taken together?
A 1400
B 400
C 280
D 138
The given bar graph shows the demand and production of colour T.Vs of five companies.
What is the difference between average demand and average production of the five companies taken together?
A 1400
B 400
C 280
D 138